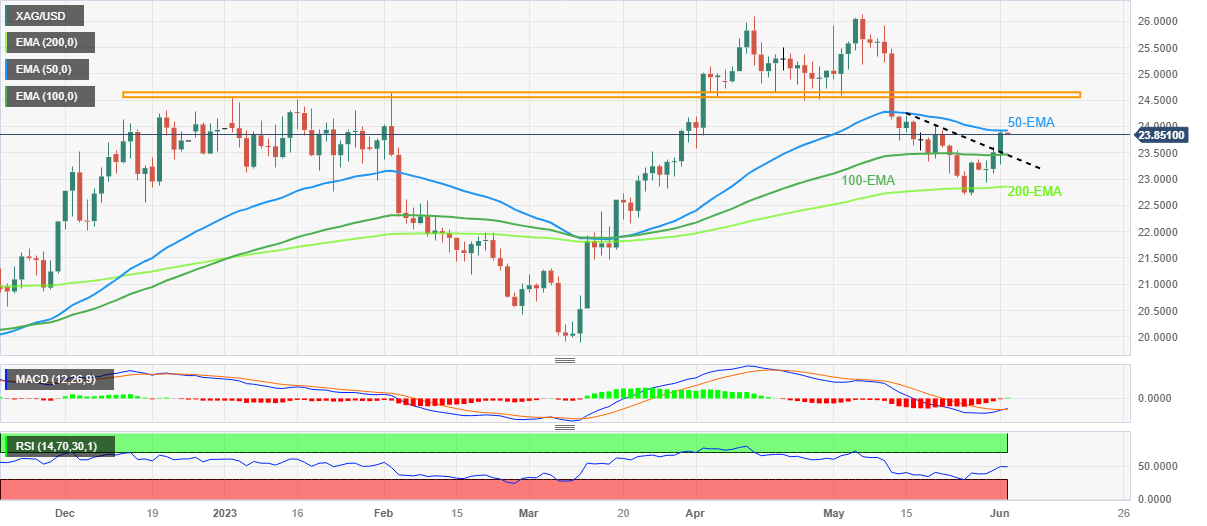
Silver Price Analysis: XAG/USD struggles to extend $23.50 resistance break
- Silver Price remains at weekly high, prods three-day uptrend.
- 50-EMA tests XAG/USD buyers amid steady RSI, looming bull cross on MACD.
- Silver sellers need validation from 200-EMA; five-month-old horizontal area appears a tough nut to crack for XAG/USD bulls.
Silver Price (XAG/USD) retreats the weekly top of $23.92, mildly offered amid Friday’s Asian session, as the metal buyers jostle with the 50-day Exponential Moving Average (EMA) ahead of the key US jobs report for May.
Even so, the XAG/USD’s sustained break of the previously key resistance confluence around $23.50, comprising the 100-EMA and a two-week-old descending trend line, keeps the Silver buyers hopeful. Adding strength to the upside bias is the steady RSI (14) line near the 50.00 mark, as well as the impending bull cross on the MACD.
With this, the Silver Price is likely to cross the immediate 50-EMA hurdle of around $23.95 and can prod the $24.00 round figure. However, multiple levels marked since early January, around $24.55-65 zone, will challenge the XAG/USD bulls afterward.
In a case where the XAG/USD price remains firmer past $24.65, the odds of witnessing the $25.00 round figure on the chart can’t be ruled out whereas the yearly high marked in May near $26.15 may lure the Silver buyers then after.
On the contrary, the stated resistance-turned-support confluence near $23.50, restricts nearby downside of the bright metal.
Following that, the 200-EMA level of around $22.85 and the previous monthly low of $22.68 will be in the spotlight.
Silver Price: Daily chart

Trend: Further upside expected
