Gold Technical Analysis: bullish breakout sets the stage for a retest of 200-DMA barrier
• Extends the post-FOMC up-move and finally broke through a key descending trend-line resistance, part of a symmetrical triangular formation on short-term charts.
• A follow-through technical buying should support an extension of the ongoing momentum further towards challenging the very important 200-day SMA.
• The $1300 round figure mark now seems to protect the immediate downside amid reviving safe-haven demand and weaker tone surrounding the US Dollar.
Gold 4-hourly chart
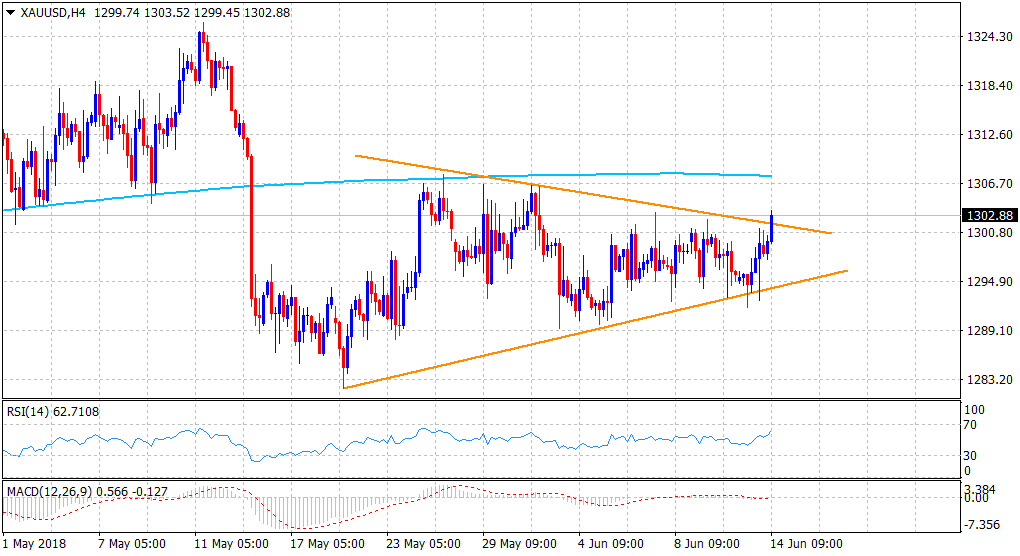
Spot Rate: $1302.88
Daily Low: $1297.56
Trend: Bullish
Resistance
R1: $1307.57 (200-day SMA)
R2: $1314.91 (May 15 swing high)
R3: $1321.30 (May month daily closing high)
Support
S1: $1301.96 (symmetrical triangle break-point)
S2: $1297.75 (100-period SMA H4)
S3: $1294.18 (ascending trend-line)