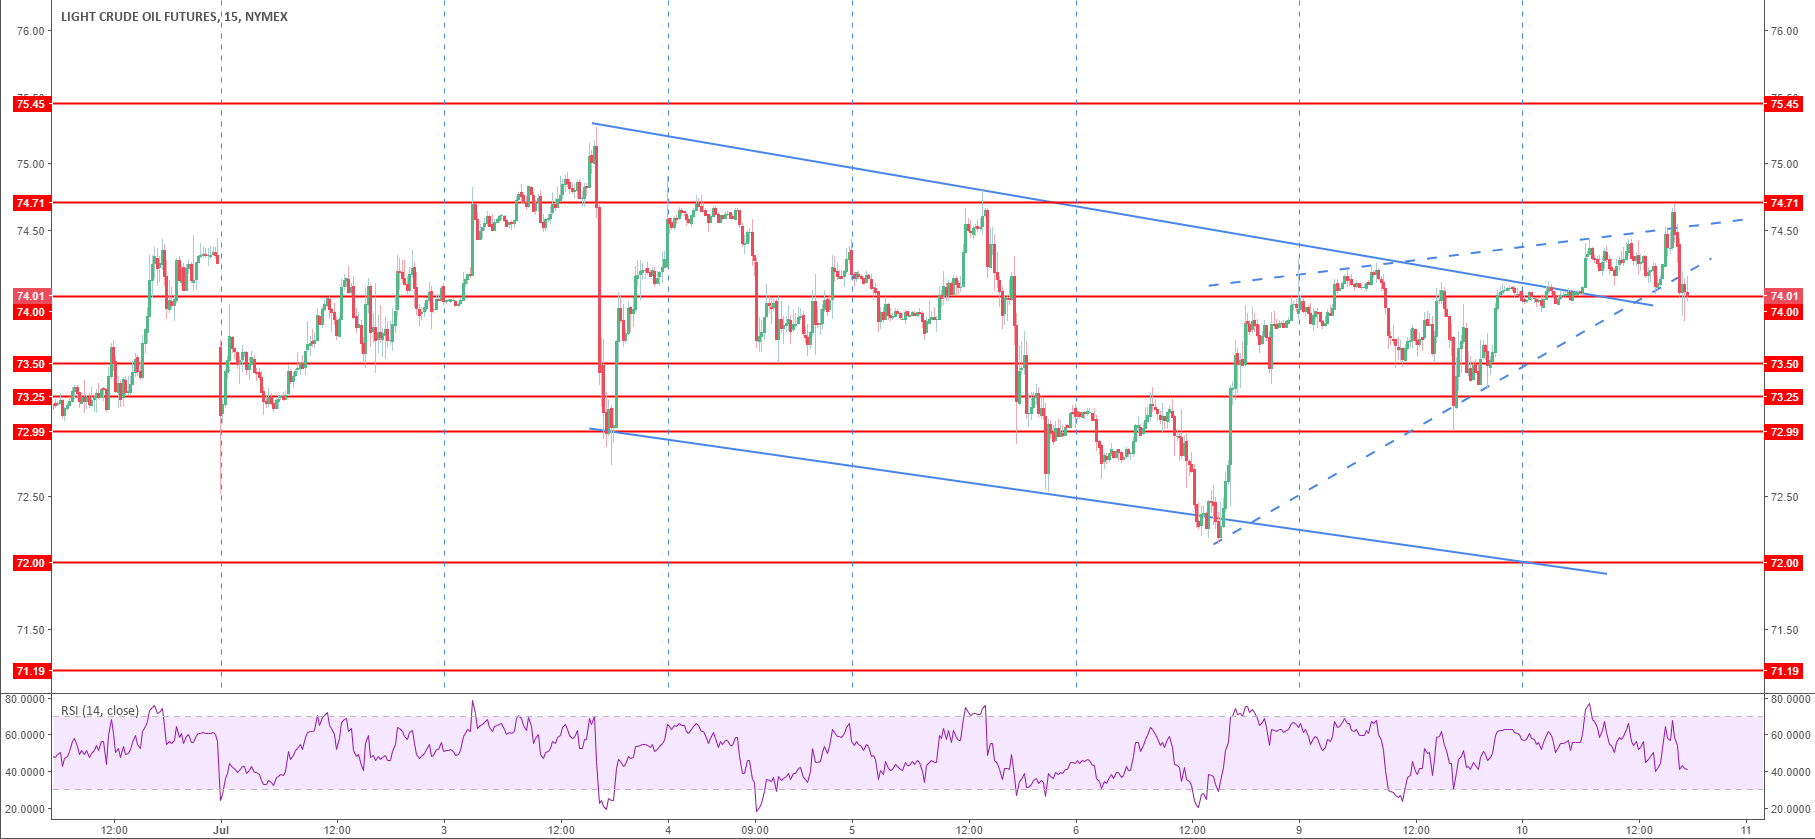
Crude Oil WTI Technical Analysis: Risky bull trap
- Crude oil pushed as high as 70.70 so far this Tuesday, just one tick shy from the 70.71 resistance, the November 17, 2014 low.
- Crude oil has been grinding higher in a wedge shape (dotted line) above the bearish upper trendline in the last three days suggesting that bulls might actually be in a bull trap.
- However, a bull breakout above 74.71 should lead to bear capitulation and the market can spike to 75.27 the current 2018 high.
Crude oil WTI 15-minute chart

Spot rate: 74.01
Relative change: 0.03%
High: 74.67
Low: 73.78
Trend: Neutral to bearish
Resistance 1: 74.71 November 17, 2014 low
Resistance 2: 75.27 current 2018 high
Resistance 3: 75.45 November 24, 2014 low
Resistance 4: 76.00 figure
Support 1: 74.00 figure
Support 2: 73.25 November 14, 2014 low
Support 3: 73.00 figure
Support 4: 72.83 June 27 swing high
Support 5: 72.00 figure
Support 6: 71.19 May 23 low
Support 7: 70.53 May 24 low
