USD/CHF Technical Analysis: 0.9900 target hit - Bears are retaking control
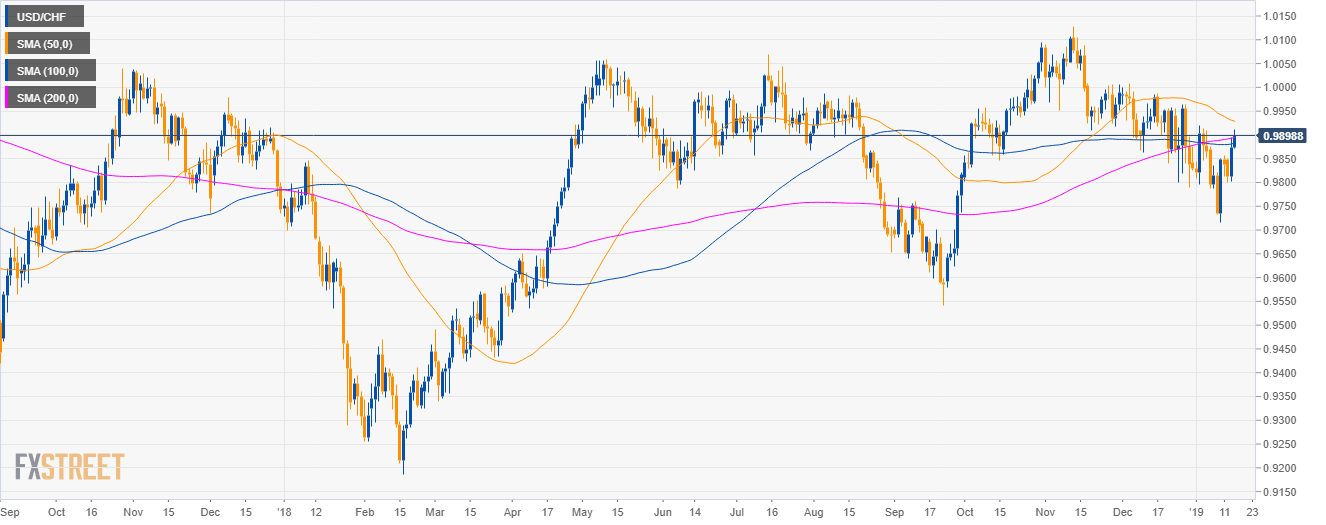
USD/CHF daily chart
- USD/CHF is trading in a sideways trend below the 50-day simple moving average (SMA).
- As forecast on January 11, bulls hit the 0.9900 target.
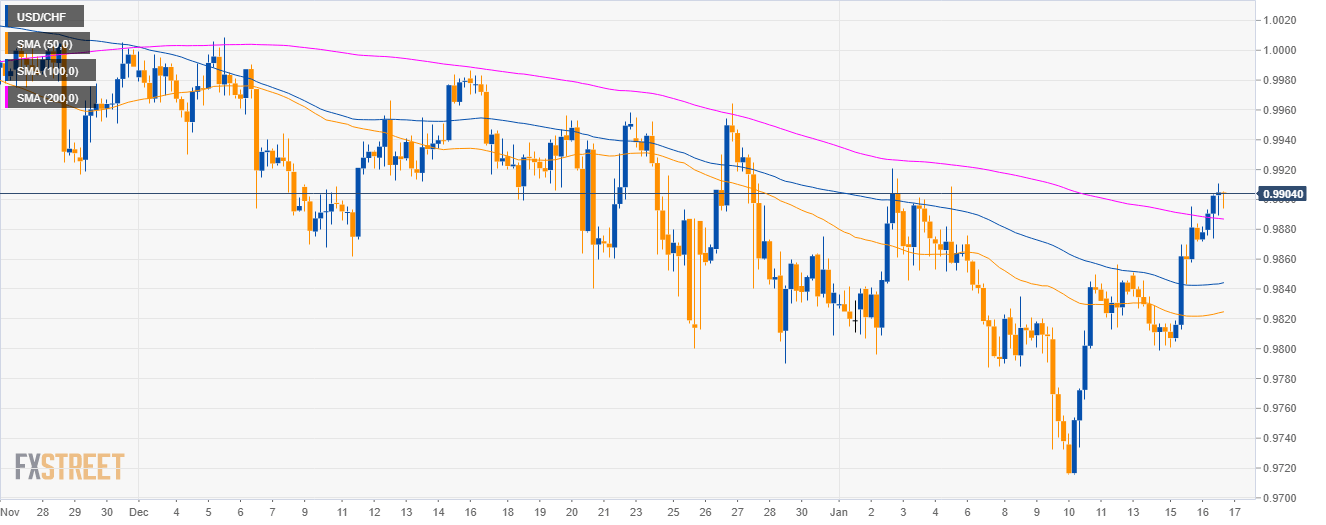
USD/CHF 4-hour chart
- USD/CHF is trading above its main SMAs.
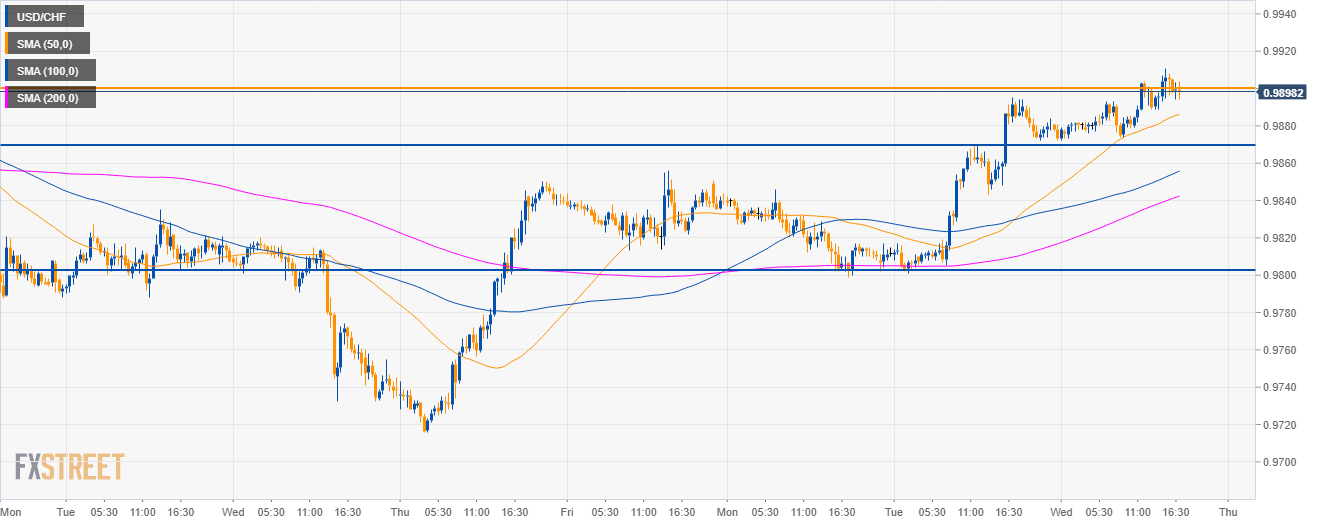
USD/CAD 30-minute chart
- The market is likely to sell-off to 0.9870 and if bears have enough steam to 0.9800 figure.
Additional key levels
USD/CAD
Overview:
Today Last Price: 1.324
Today Daily change: -29 pips
Today Daily change %: -0.219%
Today Daily Open: 1.3269
Trends:
Previous Daily SMA20: 1.3486
Previous Daily SMA50: 1.3362
Previous Daily SMA100: 1.3193
Previous Daily SMA200: 1.3091
Levels:
Previous Daily High: 1.3296
Previous Daily Low: 1.3226
Previous Weekly High: 1.339
Previous Weekly Low: 1.318
Previous Monthly High: 1.4134
Previous Monthly Low: 1.316
Previous Daily Fibonacci 38.2%: 1.3253
Previous Daily Fibonacci 61.8%: 1.3269
Previous Daily Pivot Point S1: 1.3232
Previous Daily Pivot Point S2: 1.3195
Previous Daily Pivot Point S3: 1.3163
Previous Daily Pivot Point R1: 1.3301
Previous Daily Pivot Point R2: 1.3333
Previous Daily Pivot Point R3: 1.337