Back
8 Mar 2019
EUR/USD Technical Analysis: The case for parity is playing out within long-term bearish descending channel
- EUR/USD has broken below the 61.8% Fibo retracements of the Sep 2000 lows to 2nd June 2008 highs at 1.1210, printing a low of 1.1177 overnight in the North American session.
- The next downside Fibo target is parity as the 76.4% Fibo of the same range.
- The 2nd Jan 2017 low is located at 1.0337.
- Monthly S2 is located at 1.1110. A break there, which is also a key horizontal support line, opens S3 at 1.0987.
- The 2nd Jan 2017 low is located at 1.0337.
- The downside channel makes room to below 0.9000.
- A move back to the upside needs to get back above the 50% retracement of the recent swing lows and highs and close above 1.1450, targetting channel resistance at the 38.2% fibo on the 1.17 handle. A break of the channel's top side exposes the 1.20 handle again and higher territory, cancelling prospects of parity for the foreseeable future.
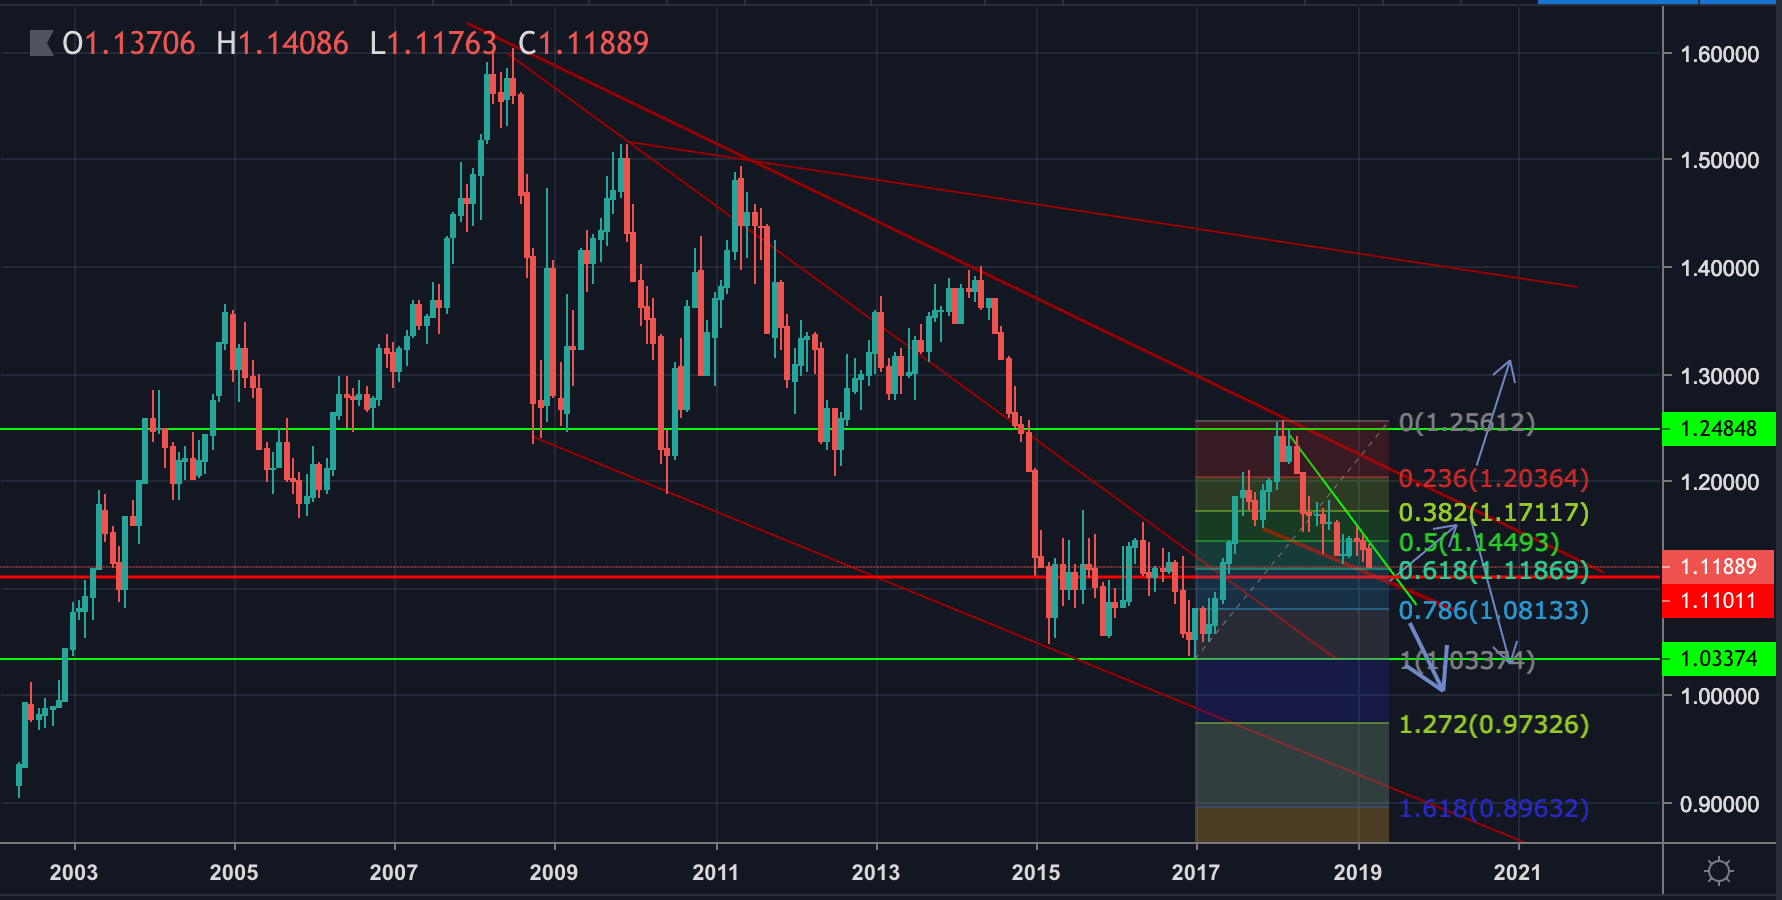
EUR/USD Monthly Chart