Back
17 Sep 2019
EUR/USD technical analysis: Euro on the rise, approaching the 1.1072 level.
- EUR/USD broke above the 1.1033 resistance and is now nearing the 1.1072 level.
- There is more volatility ahead as the market is going to watch the FOMC on Wednesday.
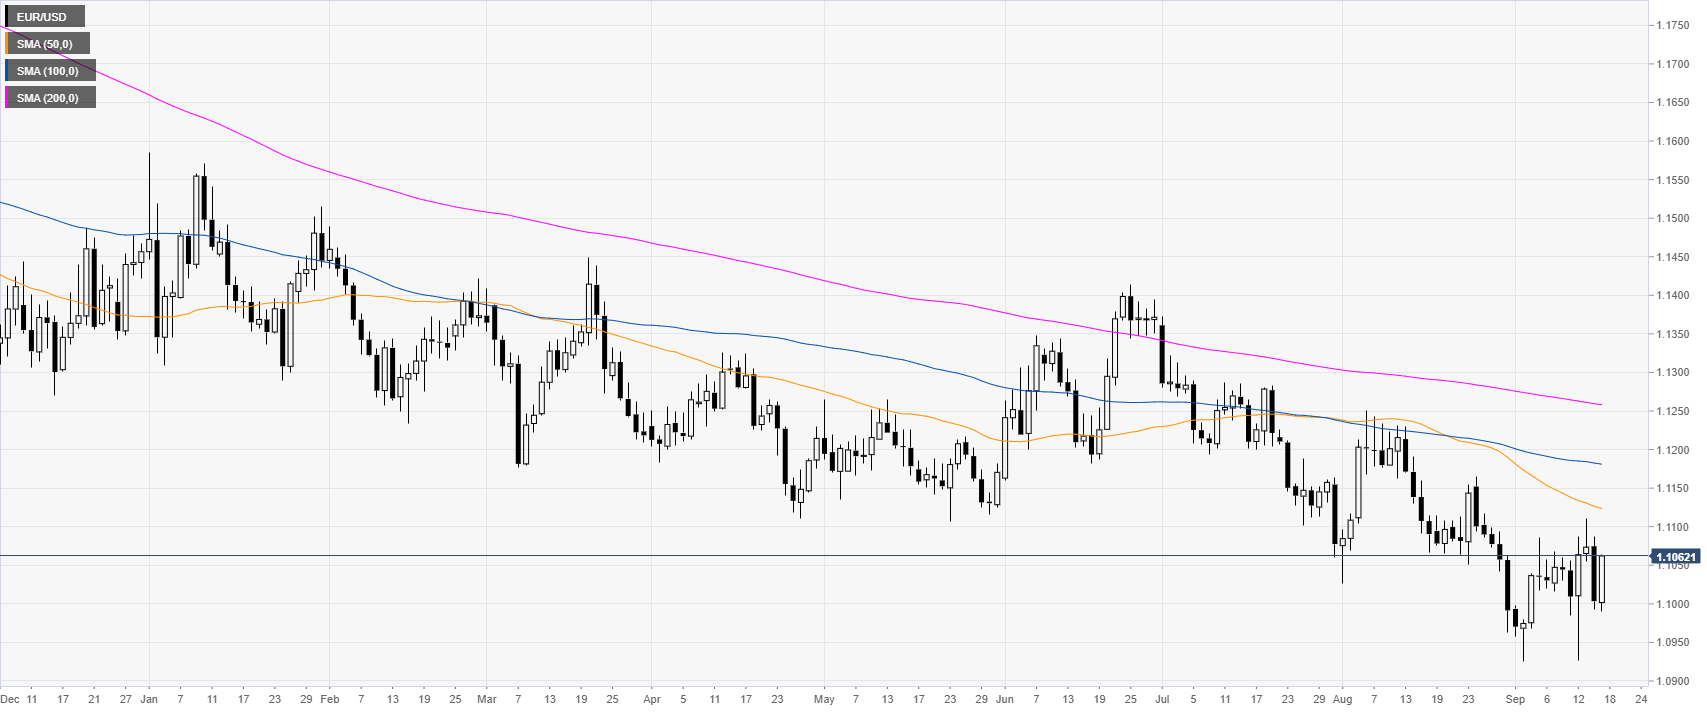
EUR/USD daily chart
The shared currency, on the daily chart, is trading in a bear trend below the main daily simple moving averages (DSMAs). It has been reported that Saudi Arabia’s oil output should return to normal faster than anticipated. This improved improved the market sentiment and sent USD down and EUR/USD up.
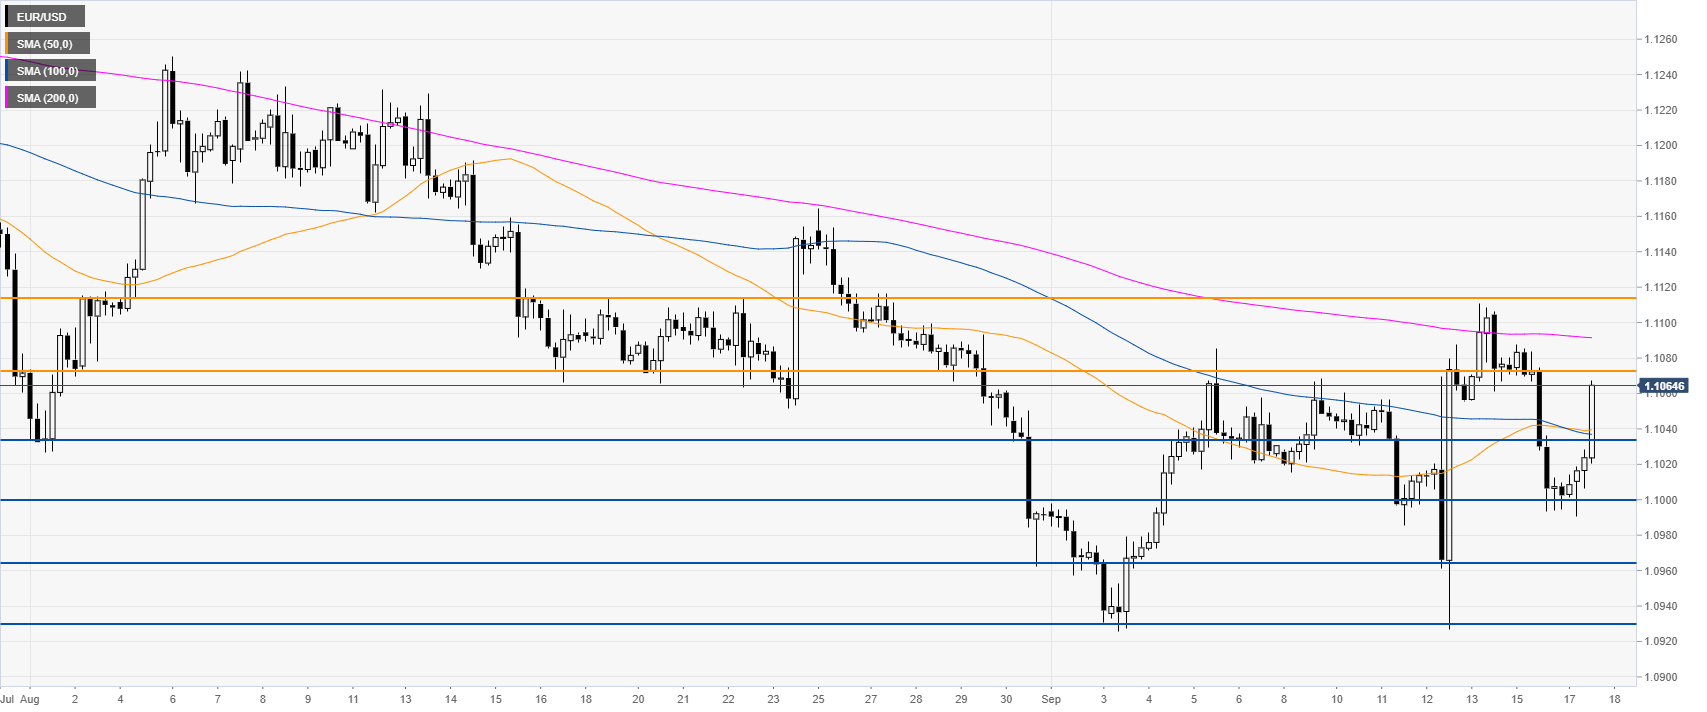
EUR/USD four-hour chart
The Fiber is rising sharply above the 1.1033 resistance and the 50/100 SMAs. The market is approaching the 1.1072 resistance. If the market break this level of resistance, the next level is seen at 1.1113, according to the Technical Confluences Indicator.
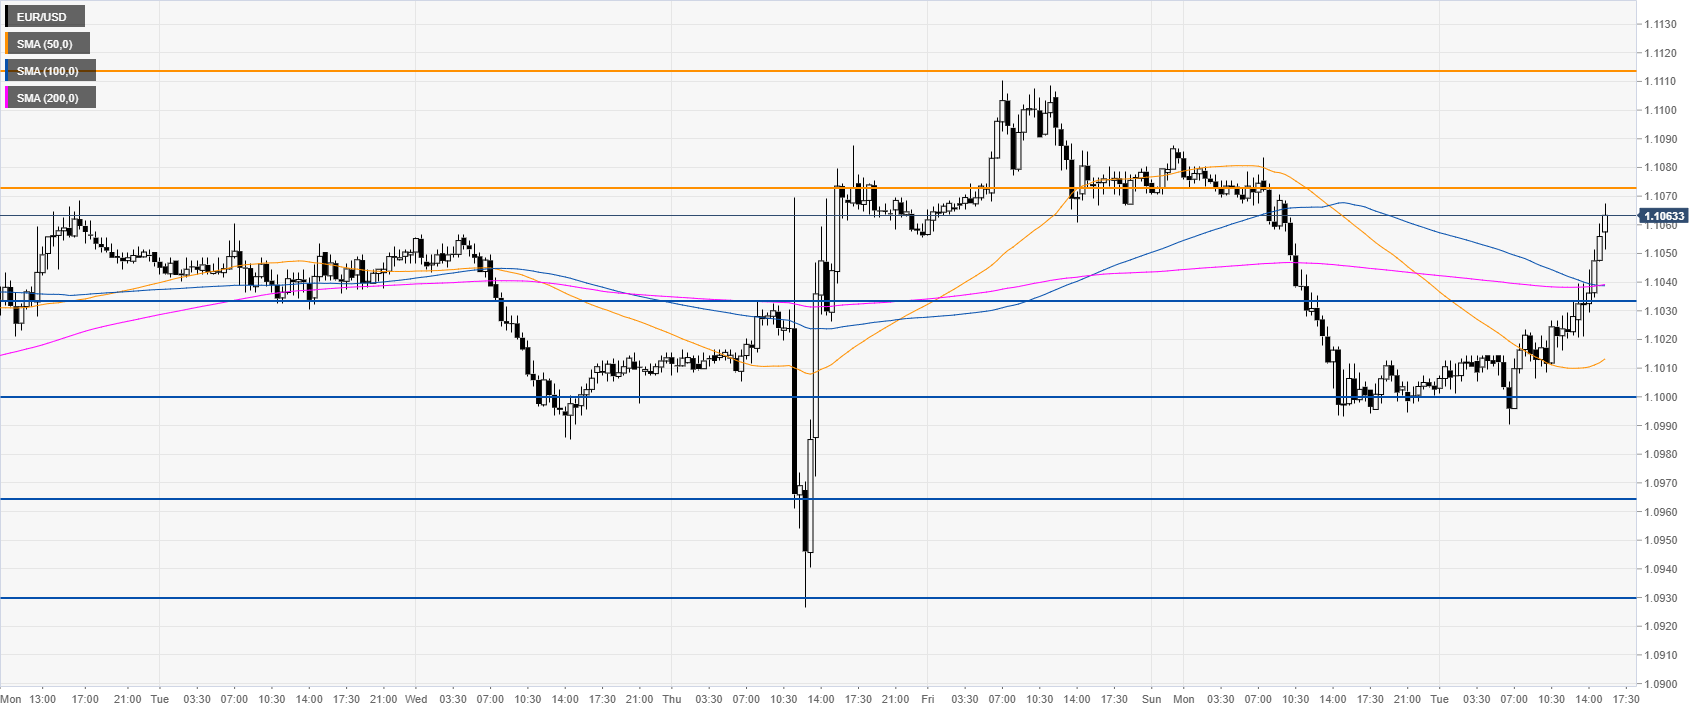
EUR/USD 30-minute chart
EUR/USD almost reversed the Monday’s losses as the market trades above the main SMAs. The market is trading within a broader range with little clarity for any directional bias. The FOMC on Wednesday might give traders clues on that front.
Additional key levels