Back
31 Oct 2019
EUR/USD technical analysis: Fiber bounces from daily lows, back near 1.1150 level
- The Euro is nearing the 1.1165 resistance at the end of the London session.
- A break above 1.1165 resistance is necessary to open the gates to further gains.
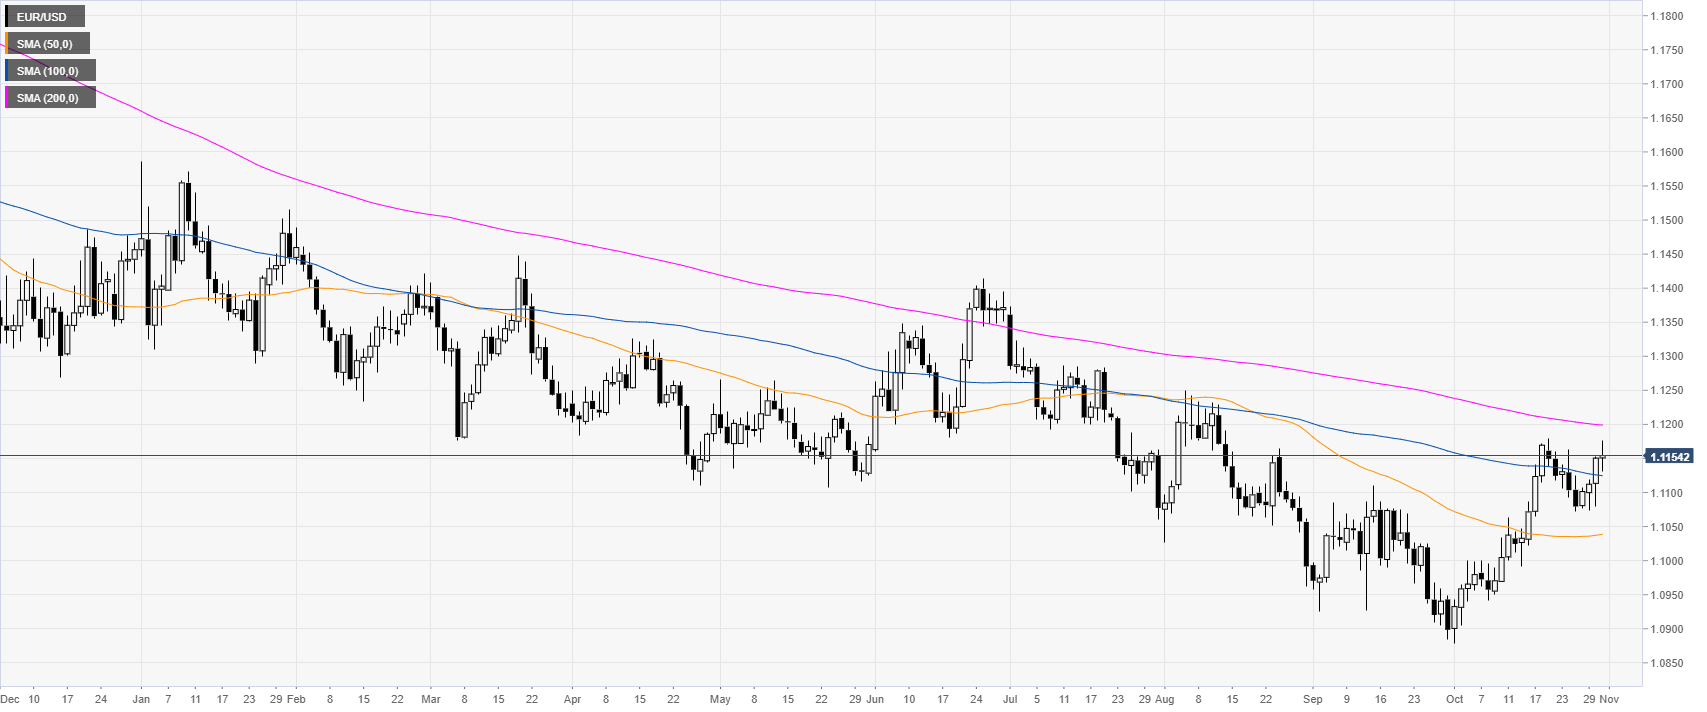
EUR/USD daily chart
On the daily chart, the Fiber is trading in a bear trend below its 200-day simple moving average (DMA). This Thursday, the spot is trying to break above the October high at the 1.1179 level.
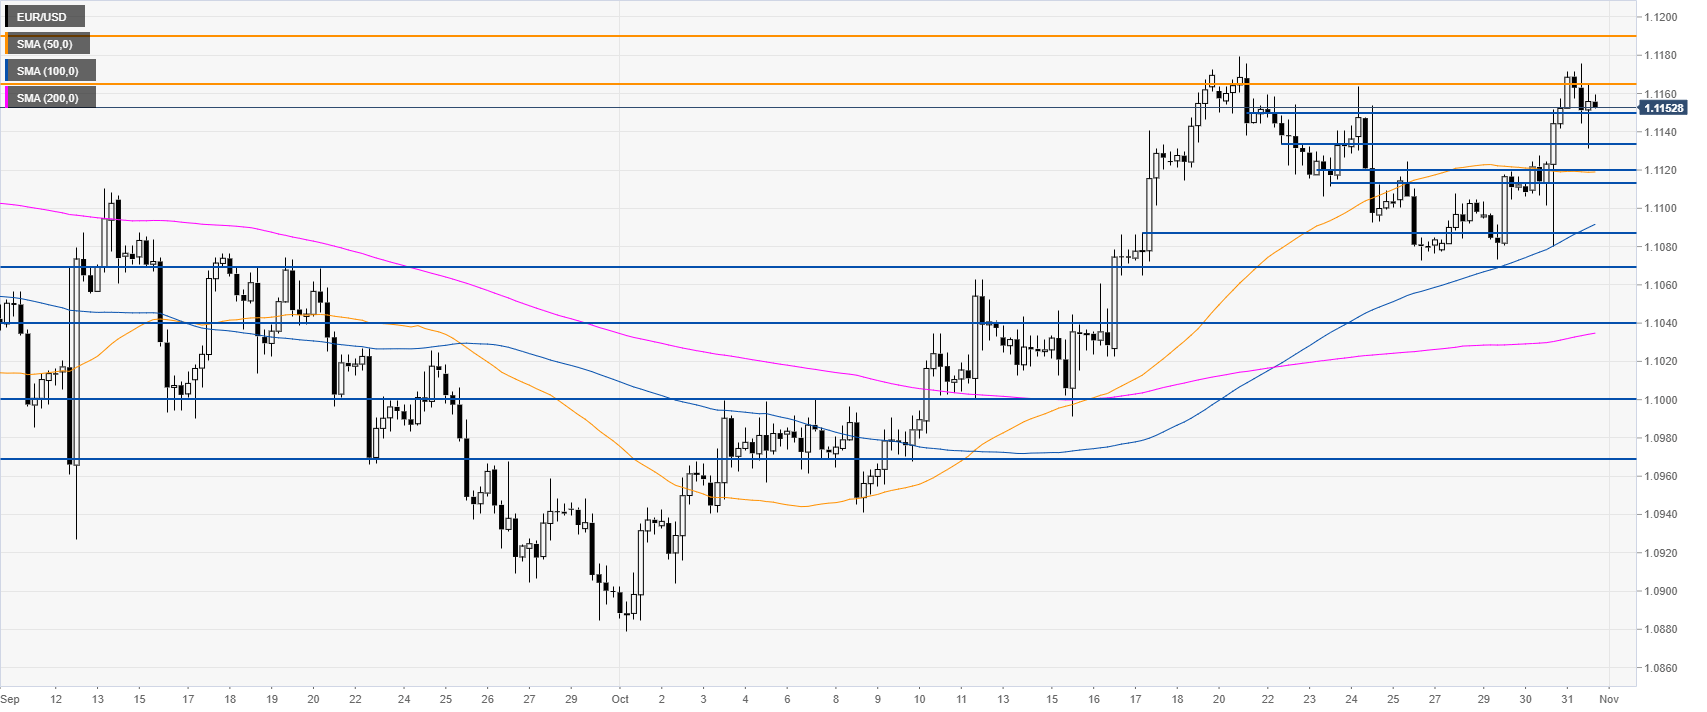
EUR/USD four-hour chart
EUR/USD, on the four-hour chart, is trading above the main SMAs suggesting a bullish momentum in the medium term. The level to beat for buyers is the 1.1165 resistance which can lead to the 1.1181/1.1193, 1.1220 and 1.1255 resistances on the way up, according to the Technical Confluences Indicator.
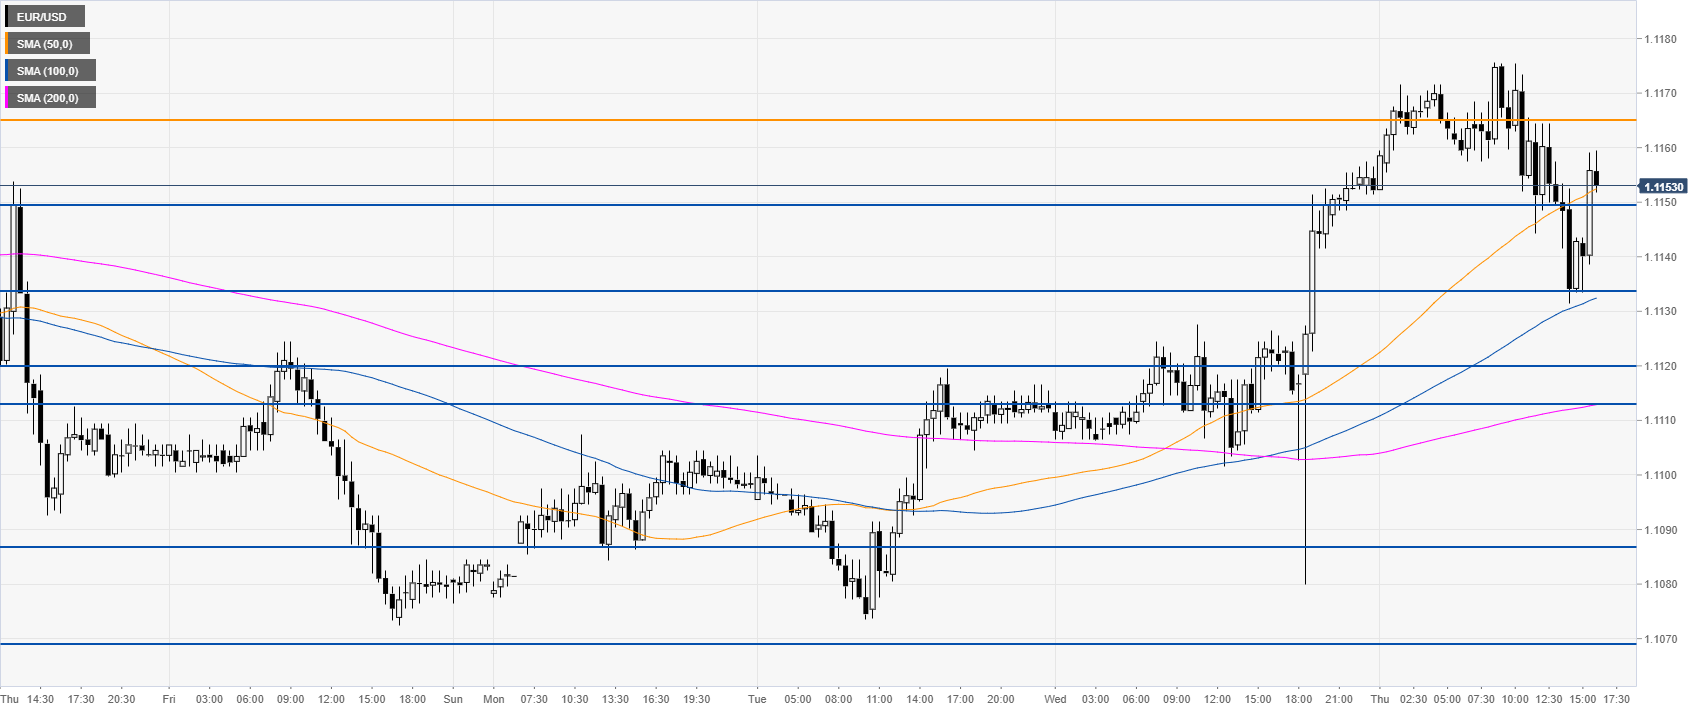
EUR/USD 30-minute chart
EUR/USD is trading above its main SMAs on the 30-minute chart, suggesting a bullish bias in the near term. Support is seen at the 1.1150, 1.1133 and 1.1113/20 price levels.
Additional key levels