USD/CAD Price Analysis: Pullback moves seek validation from 1.3000
- USD/CAD retreats from 18-month high on failure to cross immediate resistance line.
- Descending RSI line adds strength to the bearish bias.
- 100-HMA, one-week-old ascending trend line puts a floor under short-term downside.
- Bulls can aim for late 2020 swing high on crossing 1.3080 hurdle.
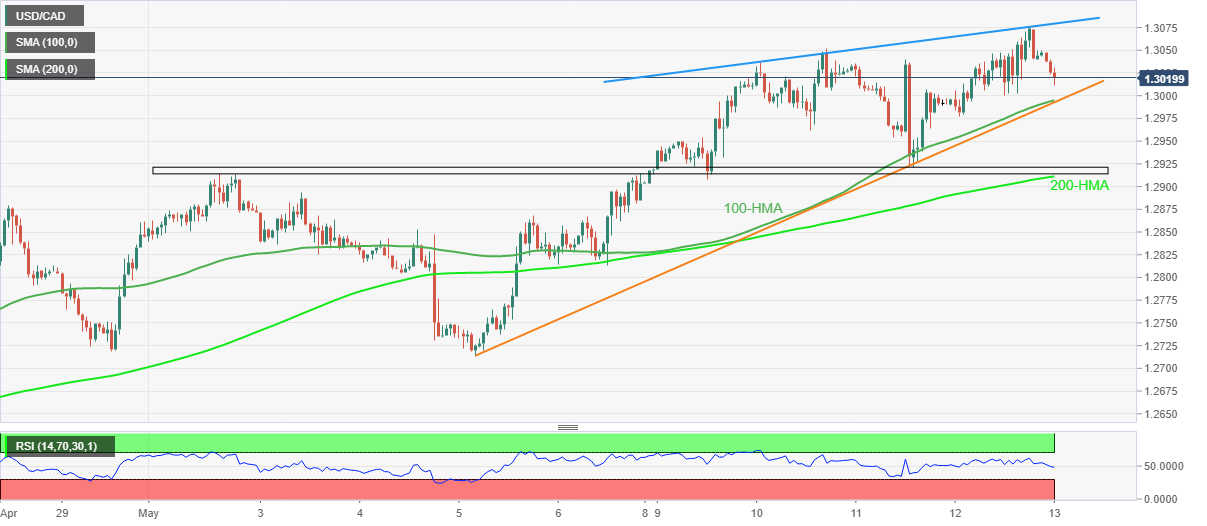
USD/CAD consolidates recent gains while easing from the highest level since November 2020, renewing an intraday low around 1.3010 by the press time of Friday’s Asia session.
In doing so, the Loonie pair portrays a pullback from a four-day-old resistance line, around 1.3080 by the press time.
Given the downward sloping RSI (14) line, not oversold, the latest weakness in prices may prevail for a bit more ahead of hitting any crucial support.
That said, a convergence of the 100-HMA and a one-week-old rising trend line appears, around 1.2995, a tough nut to crack for the USD/CAD bears.
In a case where the quote drops below 1.2995, multiple levels surrounding 1.2920-10, which includes early May’s high and the 200-HMA, will entertain the pair sellers.
On the flip side, a clear break of the aforementioned short-term resistance line of 1.3080 will need validation from the 1.3100 threshold before aiming for the late November 2020 peak of 1.3172.
To sum up, USD/CAD weakness isn’t a sign of trend reversal unless the quote breaks 1.2920.
USD/CAD: Hourly chart
Trend: Bullish